Where Does China’s Government Revenue Come From?
A data-driven guide to China’s taxes, land-sale proceeds, state capital income, social insurance funds, central-local transfers and government debt.
Government revenue is not just tax, and it is not the same as the total amount a government can spend in a year. China’s fiscal system must be read through four budget accounts, central–local transfers, and the distinction between current revenue and debt financing.
The phrase ‘Where does the government make its money?’ is useful for ordinary readers, but a government is not a company and fiscal revenue is not business profit. The state collects resources under law and reallocates them through the budget to public services, social protection, macroeconomic management and national governance.
As of July 22, 2026, the latest monthly Ministry of Finance release covered January through May. The National Bureau of Statistics had already released first-half macroeconomic data. This article uses the full-year 2025 fiscal accounts and the latest 2026 data to explain the structure, quality and sustainability of government revenue.
Key numbers at a glance
| Indicator | 2025 amount | YoY |
|---|---|---|
| General public budget revenue | 21.60 tn yuan | -1.7% |
| Tax revenue | 17.64 tn yuan | +0.8% |
| Non-tax revenue | 3.97 tn yuan | -11.3% |
| Government-managed funds revenue | 5.77 tn yuan | -7.0% |
| Land-sale proceeds | 4.15 tn yuan | -14.7% |
| State capital operations revenue | 0.85 tn yuan | +25.8% |
| Social insurance funds revenue | about 12.60 tn yuan | — |
1. Start by defining “government revenue” correctly
In Chinese fiscal news, the headline “national fiscal revenue” usually refers to general public budget revenue. This is the most frequently cited measure because it captures the taxes and non-tax receipts used to finance broad public services. But it is not the whole government revenue system. China also has a government-managed funds budget, a state capital operations budget and a social insurance funds budget.
It is equally important to separate current revenue from available fiscal resources and financing. A government may spend more in a year than it collects in current revenue because it can draw on carryovers, budget stabilisation funds, transfers from other accounts and government bonds. These sources expand room for spending, but they do not have the same economic meaning or sustainability.
Taxes and regular non-tax receipts are current revenue. Carryovers and transfers enlarge the resources available in the current year. Bonds bring future fiscal resources forward and create repayment obligations. Mixing the three leads to a distorted picture of fiscal capacity.
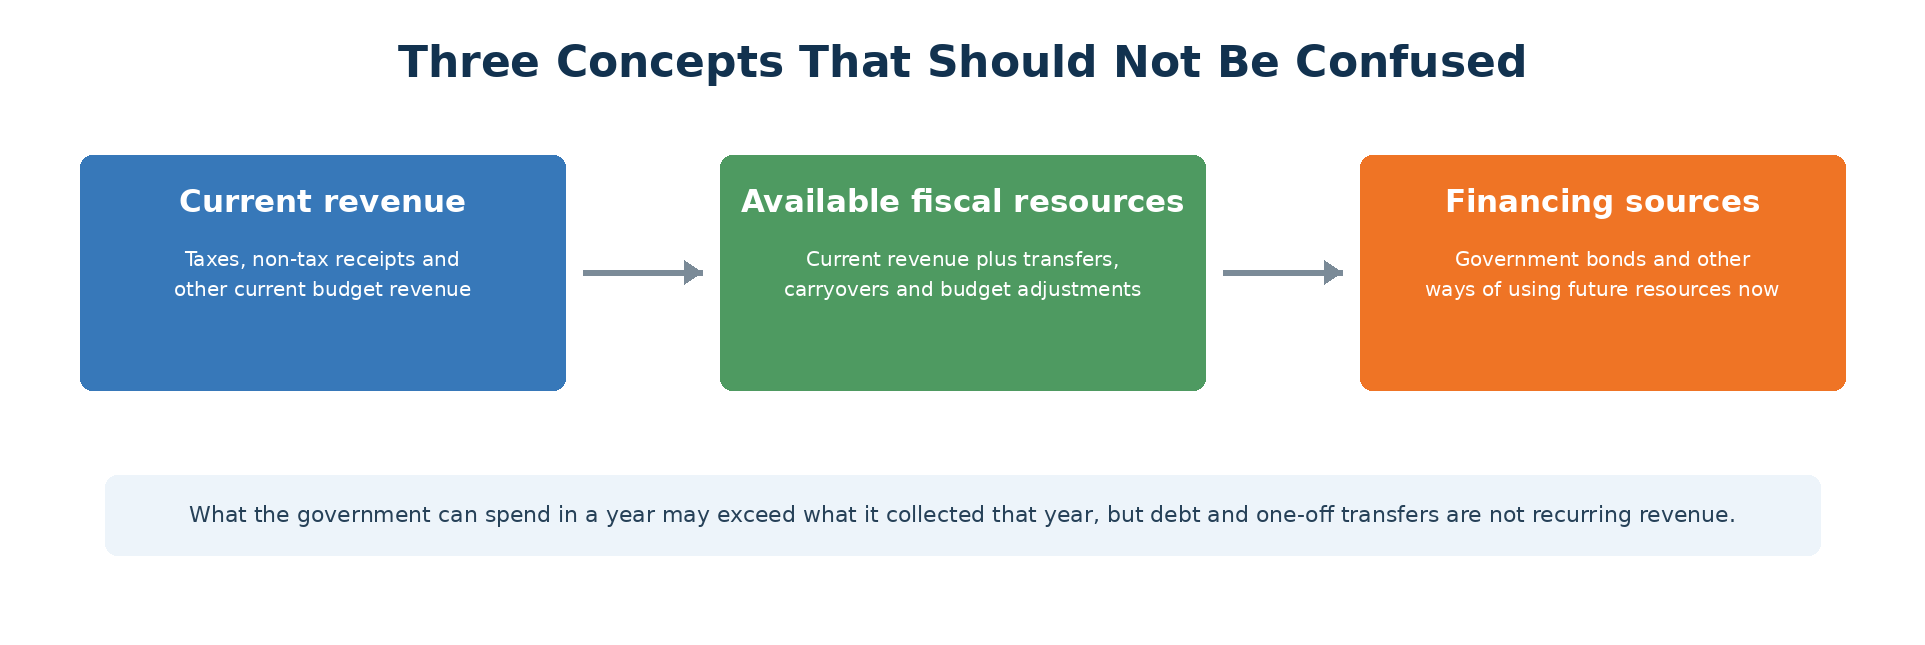 Figure 1. Current revenue, available fiscal resources and financing are different concepts.
2. Revenue is organised through four budget accounts
China’s government budget system has four main accounts, each with a different revenue base and purpose.
The general public budget is the core account. It is funded mainly by taxes and non-tax receipts and pays for government operations, education, science, social protection, health care, public security, defence, agriculture and many other public functions. Revenue reached 21.60 trillion yuan in 2025.
The government-managed funds budget is based on earmarked sources and uses. The most important local item is revenue from transfers of state-owned land-use rights. Total fund revenue was 5.77 trillion yuan in 2025, including 4.15 trillion yuan from land transfers.
The state capital operations budget records the return earned by the state as the owner of public capital, including profit remittances, dividends and proceeds from equity transfers. Revenue was 854.7 billion yuan in 2025.
The social insurance funds budget covers pension, medical, unemployment and work-injury insurance contributions, fiscal subsidies and related benefit payments. Revenue was about 12.60 trillion yuan in 2025, but the money is earmarked for social insurance and cannot be treated as a general pool of discretionary revenue.
The four accounts also transfer money among themselves. State capital revenue may be transferred to the general public budget, while the general public budget subsidises social insurance funds. Adding the four totals without eliminating these flows creates double counting and exaggerates the amount of freely spendable revenue.
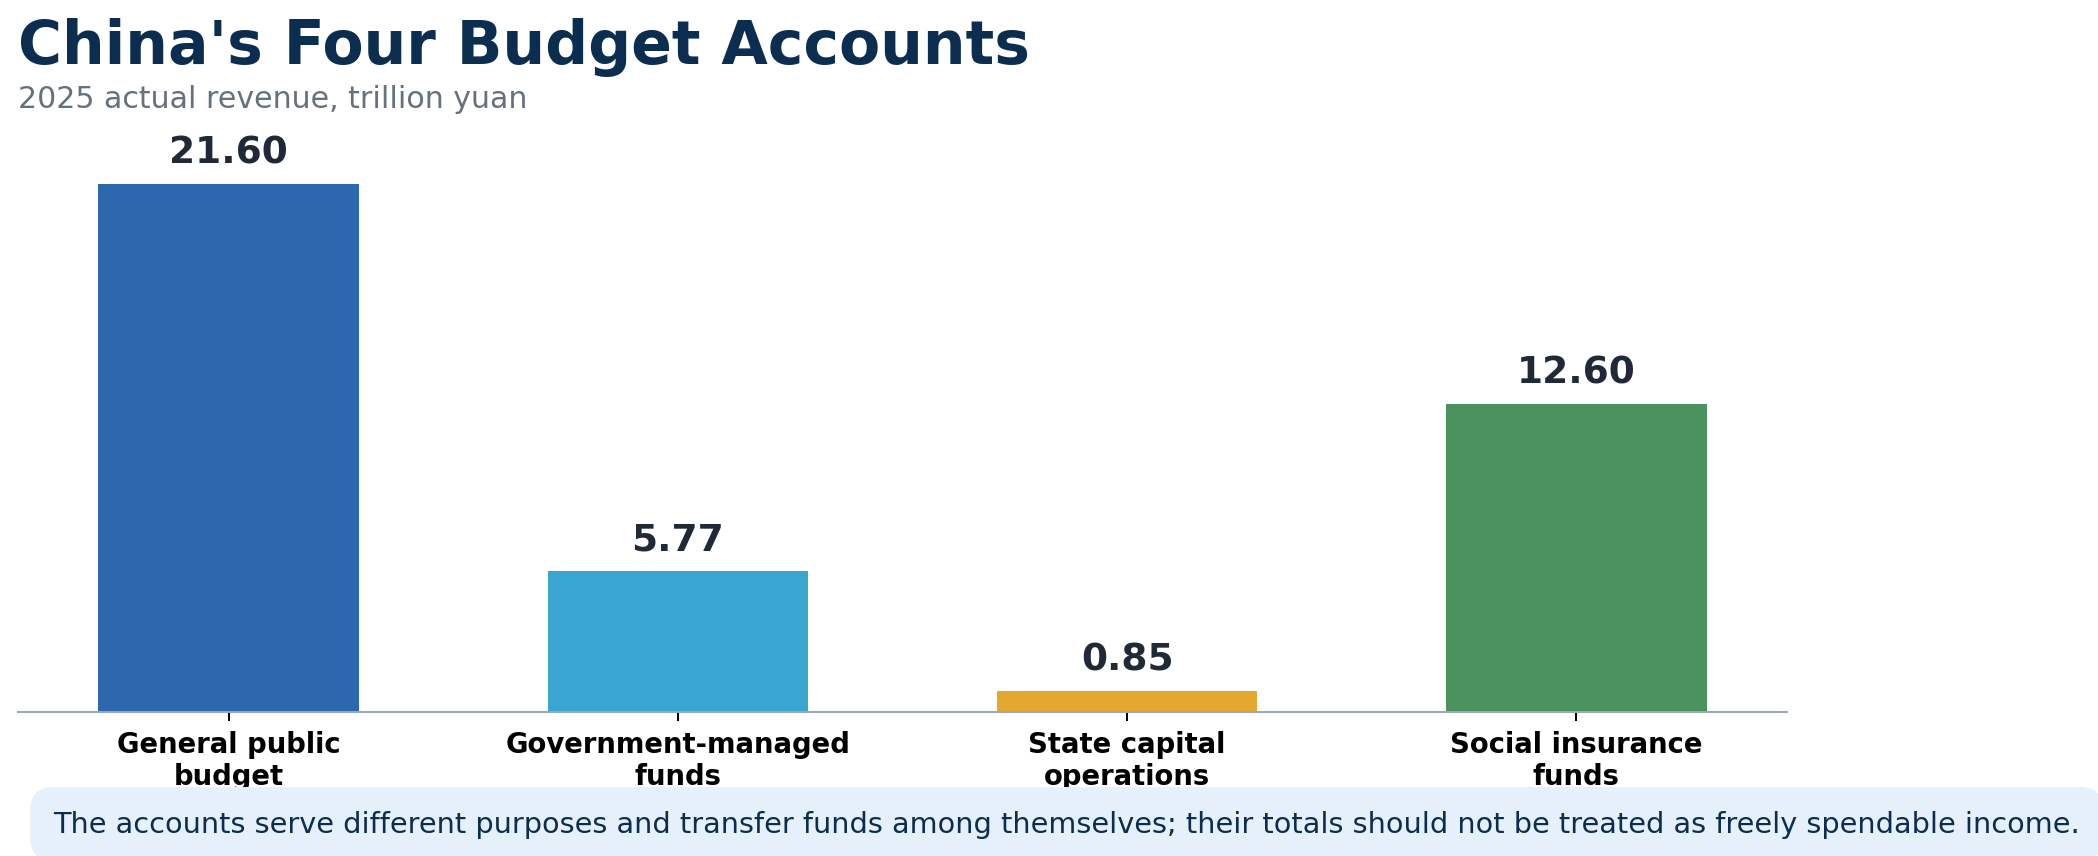 Figure 2. Revenue in China’s four budget accounts in 2025. Source: Ministry of Finance.
3. Taxes remain the core of the main budget
In 2025, general public budget revenue was 21.6045 trillion yuan, down 1.7%. Tax revenue was 17.6363 trillion yuan, up 0.8%, while non-tax revenue was 3.9682 trillion yuan, down 11.3%. Taxes therefore accounted for about 81.6% of the main budget.
The importance of taxes lies not only in their size but also in their recurring base. Production, consumption, profits, wages and property transactions continually generate tax revenue. Some non-tax receipts, by contrast, come from asset disposals, resource transfers or one-off profit remittances and may not be repeatable.
Tax revenue is not mechanically stable, however. VAT responds to sales, prices and input deductions; corporate income tax to profits and incentives; individual income tax to wages, business income and capital-market activity; and property-related taxes to transactions and prices. Fiscal revenue is therefore the combined result of economic activity and policy design.
4. Four major taxes form the backbone of the system
Domestic VAT generated 6.89 trillion yuan in 2025, corporate income tax 4.13 trillion yuan, domestic consumption tax 1.69 trillion yuan and individual income tax 1.62 trillion yuan. Together they accounted for about 81.3% of total tax revenue.
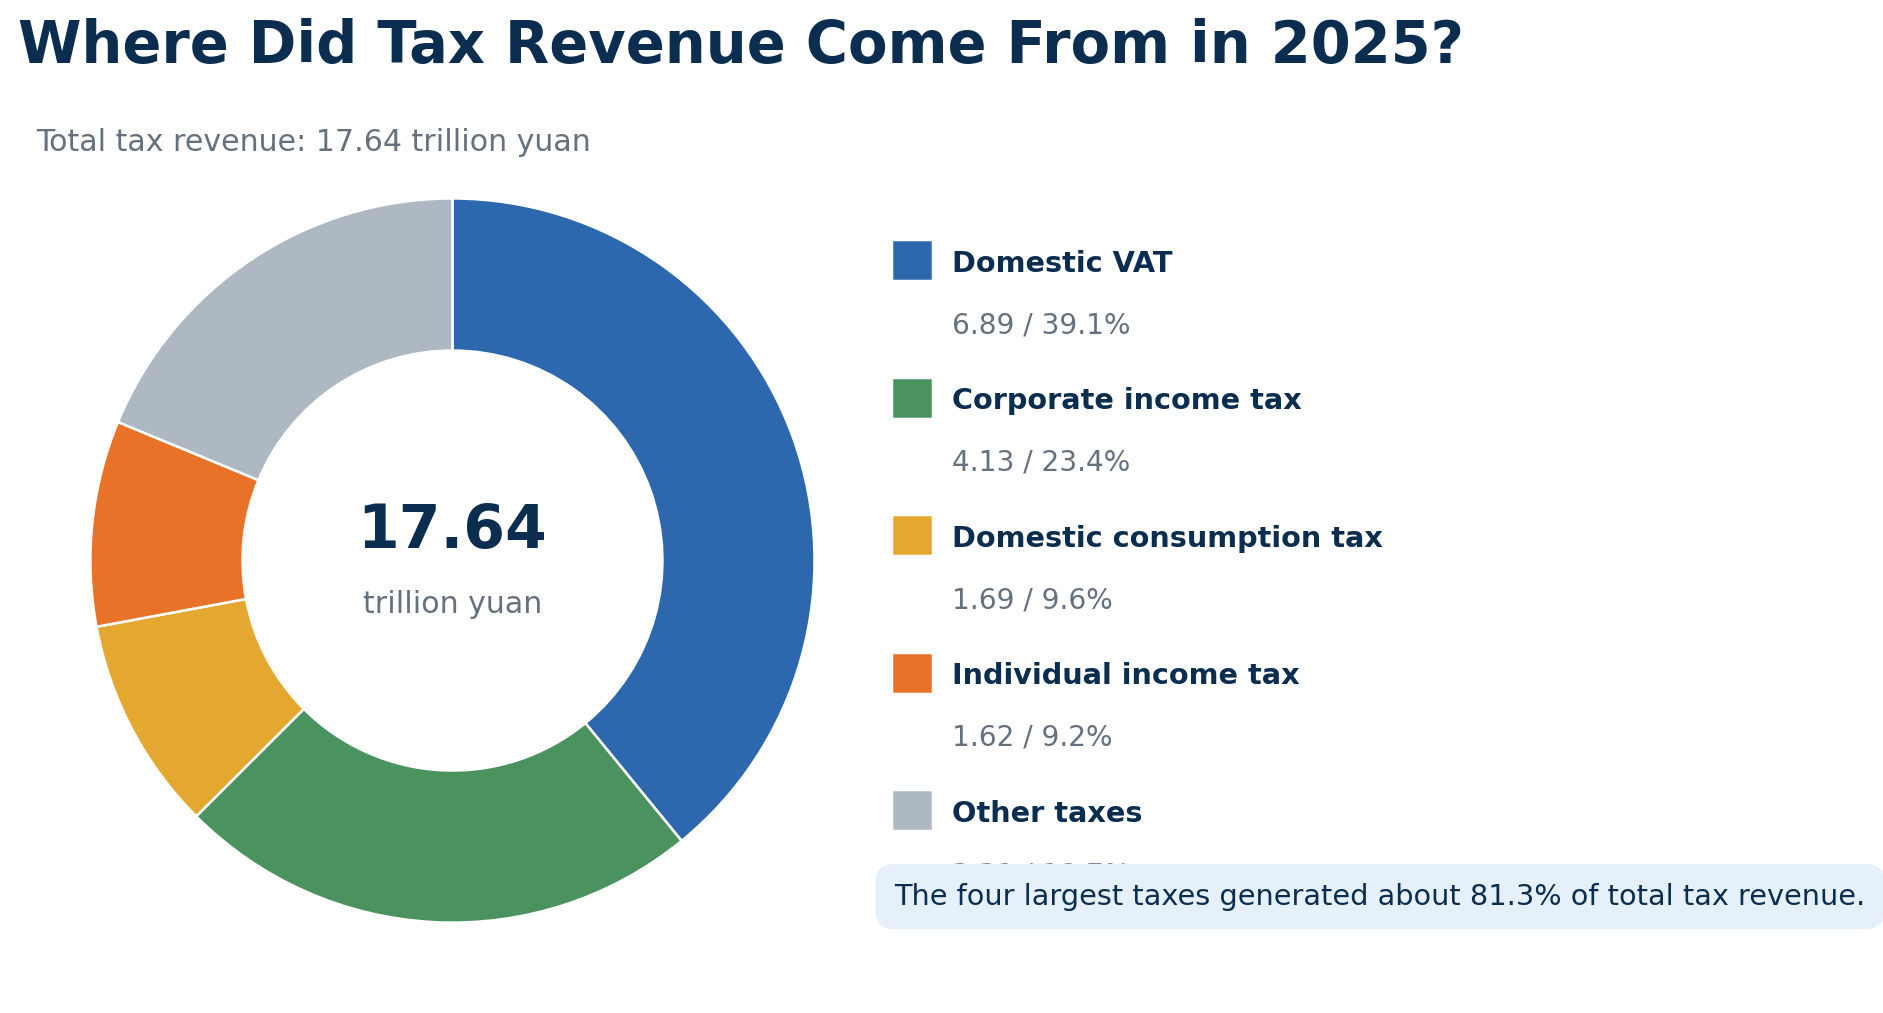 Figure 3. Structure of major tax revenue in 2025. Source: Ministry of Finance.
4.1 VAT: the largest tax and a window into the nominal economy
VAT is levied on the value added in the sale of goods and services. A business charges output VAT on sales and deducts eligible input VAT paid on purchases, equipment and services.
Domestic VAT revenue rose 3.4% to 6.8947 trillion yuan in 2025 and increased 6.2% year on year in January–May 2026. VAT is influenced by transaction volumes, prices, input-credit chains, VAT refunds and export rebates. It therefore tracks nominal economic activity more closely than real GDP alone.
If output expands but prices fall, sales values and VAT may grow slowly. If prices rise, the tax base may expand even when real volumes change little. VAT should always be read alongside both real growth and price indicators.
4.2 Corporate income tax: sales are not the same as profits
Corporate income tax is based on taxable profit rather than gross revenue. Firms with similar sales can pay very different amounts depending on costs, margins, loss carry-forwards and tax incentives.
Revenue was 4.1304 trillion yuan in 2025, up 1%, and 2.188 trillion yuan in January–May 2026, up only 0.2%. VAT grew much faster over the same period. This does not prove that firms were generally unprofitable, but it does show that stronger transaction-related tax bases did not translate proportionally into taxable profits.
R&D super-deductions, preferential rates for high-tech and small firms, accelerated depreciation and loss offsets can all reduce current corporate tax while supporting investment and cash flow. Corporate income tax reflects both profitability and the operation of industrial and innovation policy.
4.3 Individual income tax is not just a wage tax
China taxes wages and salaries, labour remuneration, author royalties, royalties from licensed rights, business income, interest and dividends, rental income, property transfers and windfall income under the individual income tax system.
Individual income tax revenue rose 11.5% to 1.6187 trillion yuan in 2025. The Ministry of Finance said that higher wage income as well as more active equity transfers and dividend income contributed to the increase. Revenue grew another 12.2% in January–May 2026.
The rise should not be interpreted automatically as a sharp increase in the burden on ordinary salaried workers. The monthly fiscal release does not provide a breakdown by income source, so conclusions about wages, business income or capital income must remain cautious.
4.4 Consumption tax: selective taxation with a regulatory purpose
Consumption tax is levied selectively on products such as tobacco, alcohol, refined oil and automobiles. It raises revenue but also discourages particular forms of consumption, conserves resources and supports environmental goals.
Revenue reached 1.6857 trillion yuan in 2025, up 2%, but fell 3.1% in January–May 2026. The tax is affected by volumes, prices, rates and the point at which it is collected. Moving the collection stage of selected items downstream and sharing part of the revenue with local governments remains an important reform direction.
5. Other taxes reveal trade, capital-market and property cycles
Import VAT, import consumption tax and customs duties move with trade volumes and prices. Export tax rebates are not revenue; they refund taxes previously borne by exporters and can materially affect fiscal cash flow. Export rebates reached 2.1337 trillion yuan in 2025, up 10.7%.
Stamp tax covers contracts, property-transfer documents and securities transactions. Securities transaction stamp tax rose 57.8% in 2025 and 88.8% in January–May 2026, signalling much more active market turnover. It is, however, highly cyclical.
Deed tax and land appreciation tax are closely tied to property transactions and development. In 2025 they fell 14.1% and 15.7% respectively; in January–May 2026 they declined another 14.8% and 14.2%. Both belong to the general public budget, which shows that the property correction affects more than land-sale proceeds.
Property tax and urban land-use tax are linked more to holding and use. They rose 10.8% and 5.2% in 2025. Different property-related taxes can therefore move in different directions and should not be collapsed into a single indicator.
6. Non-tax revenue is normal, but its composition matters
Non-tax revenue includes administrative fees, fines and penalties, paid use of state-owned resources, rental and disposal income from public assets, and other earmarked receipts. It is a legitimate part of the fiscal system and is not synonymous with arbitrary charges.
The key issue is persistence. Regular, rules-based receipts are different from one-off asset sales or special remittances. National non-tax revenue fell 11.3% in 2025 largely because a one-off remittance by central institutions had raised the 2024 comparison base.
Three questions help assess quality: Was the revenue collected lawfully? Did it depend on asset disposal or an unusual remittance? Can it recur next year? A rise is not automatically a sign of healthier finances, and a fall is not necessarily evidence of weaker administration.
7. Land-sale proceeds remain central to local fiscal conditions
Land-sale proceeds are recorded in the government-managed funds budget, not the general public budget. Revenue from transfers of state-owned land-use rights fell 14.7% to 4.1518 trillion yuan in 2025, equal to about 72% of total fund revenue. It dropped another 28.7% in January–May 2026.
This is gross revenue, not a local-government profit figure. Land acquisition, compensation, resettlement, site development, urban construction and related debt obligations also have to be financed. Land-related fund expenditure was 4.7120 trillion yuan in 2025.
The property adjustment creates a double effect: lower land sales reduce the fund budget, while weaker transactions and development reduce deed tax, land appreciation tax and taxes from related industries in the general public budget. The challenge is therefore broader than losing one source of cash.
A durable local fiscal transition requires more stable tax bases, a better local tax system, clearer matching of expenditure responsibilities and transfers, and less dependence on land- and debt-driven urban development.
8. State capital revenue and social insurance contributions are different from taxes
State capital operations revenue is the return earned by the government as an owner. It rose 25.8% to 854.7 billion yuan in 2025, with a particularly strong increase at the central level after higher collection ratios were applied to some central state-owned enterprises.
State-owned firms do not remit all profits. They retain resources for capital needs, strategic investment, expansion and debt repayment. A portion of state capital revenue can be transferred to the general public budget.
Social insurance funds receive employer and employee contributions as well as fiscal subsidies. Revenue was about 12.60 trillion yuan in 2025. Because subsidies from the general public budget are included, simply adding the two budgets would double-count part of government resources.
Social insurance contributions may be relevant when assessing the total burden on employers and workers, but they come with a clearer contribution-benefit link and are earmarked for pensions, medical care, unemployment and work-injury benefits. They are not equivalent to discretionary tax revenue.
9. What the centre collects is not what the centre spends
In 2025, central general public budget revenue was 9.3963 trillion yuan and local own-source revenue was 12.2082 trillion yuan. On the spending side, central government own spending was 4.3034 trillion yuan, while local spending reached 24.4361 trillion yuan—about 85% of the national total.
This is a defining feature of China’s intergovernmental fiscal system. Revenue is divided between levels of government, while a large share of education, health care, social protection, public security, urban services and local infrastructure is delivered by subnational governments.
The centre uses tax rebates and transfers to narrow vertical and regional fiscal gaps. The 2026 central budget provides 10.415 trillion yuan in general public budget transfers to local governments. Local fiscal capacity therefore depends on own-source revenue, transfers, carryovers, budget adjustments and borrowing.
Comparing regions only by own-source revenue can be misleading. A region with a small tax base may receive substantial transfers, while a richer region may make larger contributions to national equalisation. Available resources, rigid spending obligations and fiscal self-sufficiency matter more than a single revenue figure.
10. Deficits and bonds are not revenue, but they determine fiscal scale
When planned spending exceeds current revenue and available budget adjustments, the gap is financed through the fiscal deficit and government debt. Borrowing expands current fiscal capacity but creates future principal and interest obligations.
For 2026, national general public budget revenue is projected at 22.07 trillion yuan. After transfers from other accounts and use of carryovers, total available revenue is 24.12 trillion yuan, while expenditure is budgeted at 30.01 trillion yuan. The resulting deficit is 5.89 trillion yuan. Local special-purpose bonds and ultra-long special treasury bonds mainly operate through the government-managed funds budget.
This is why current revenue, total budget resources and financing capacity must be analysed separately. The stance of fiscal policy depends not only on tax growth but also on deficits, bond issuance, central transfers, use of accumulated balances and the pace of spending.
Debt quality also depends on use. Borrowing for routine operating costs differs from borrowing for long-lived public infrastructure that creates assets and social returns. In every case, the borrower, maturity structure, interest burden and future fiscal capacity remain essential.
11. January–May 2026: stronger totals, sharp internal divergence
As of July 22, 2026, the latest monthly fiscal release from the Ministry of Finance covered January through May. General public budget revenue reached 10.0465 trillion yuan, up 4%. Tax revenue rose 4.4% and non-tax revenue 2.2%.
The pace improved through the year: headline revenue grew 0.7% in January–February, 2.4% in the first quarter, 3.5% in January–April and 4% in January–May. Tax revenue outpaced non-tax revenue, suggesting that the improvement relied more on recurring tax bases than on temporary non-tax receipts.
The composition was uneven. Domestic VAT rose 6.2%, individual income tax 12.2%, import VAT and consumption tax 10.4%, and securities transaction stamp tax 88.8%. Corporate income tax grew only 0.2%, while domestic consumption tax fell 3.1%.
Land and property revenue remained weak. Land-sale proceeds fell 28.7%, deed tax 14.8% and land appreciation tax 14.2%. Recovery in the general public budget has therefore not removed pressure on local government-managed funds.
China’s GDP grew 4.7% in the first half of 2026, with a 4.3% increase in the second quarter. Prices also moved into modest positive territory. The fiscal data still cover only five months, so the series cannot be matched one for one, but the macro backdrop is more supportive of subsequent tax growth.
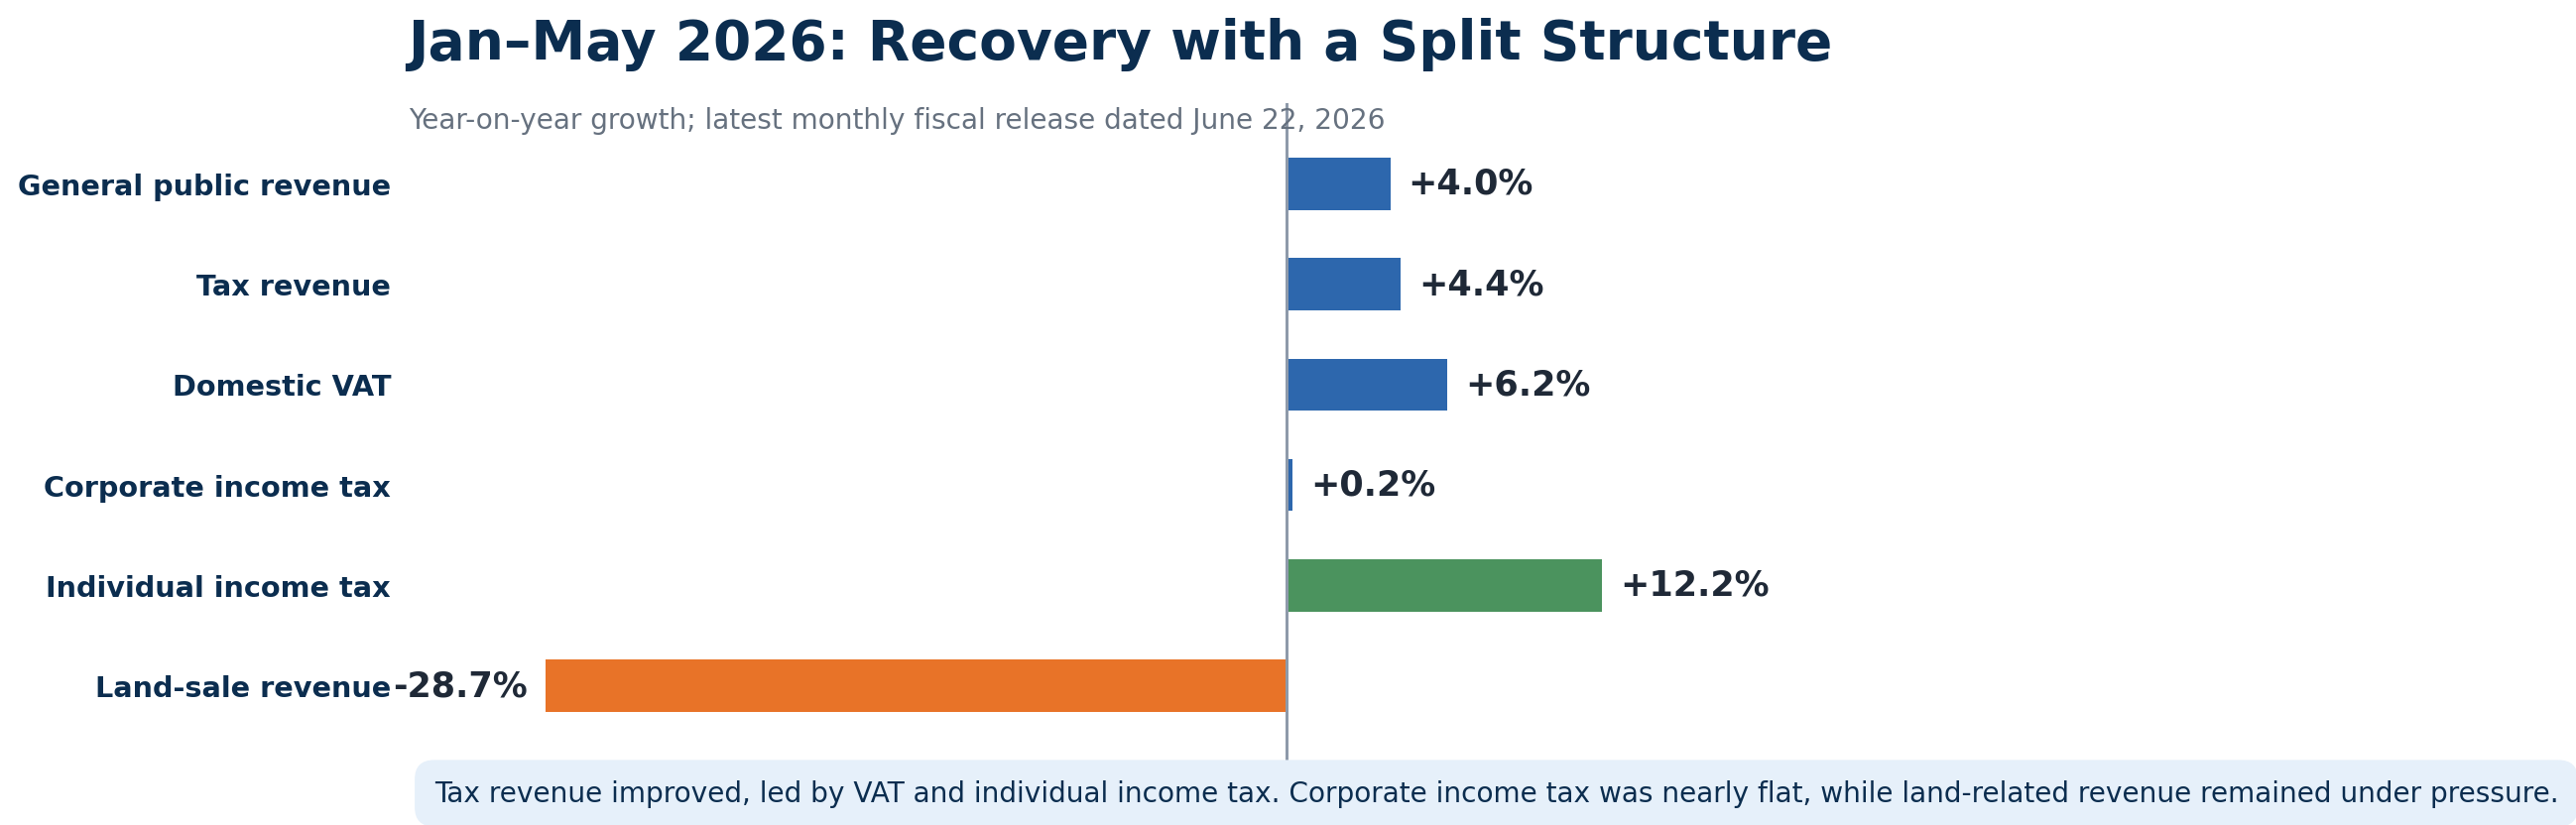 Figure 4. Year-on-year changes in selected revenue indicators, January–May 2026. Source: Ministry of Finance.
12. Why can GDP grow while fiscal revenue falls?
China’s GDP reached 140.19 trillion yuan in 2025 and grew 5.0% in real terms, while general public budget revenue fell 1.7%. The apparent contradiction disappears once the measurement differences are recognised.
Real GDP removes price changes, while most taxes are based on current-price sales, income, profits and transactions. Real output can rise while nominal tax bases remain weak if prices are low.
GDP measures value added, not corporate profit. Wages, interest, depreciation and other costs affect the distribution of value added, while taxable profit is further shaped by loss offsets and incentives.
Tax cuts, R&D deductions, VAT refunds and export rebates can reduce current revenue while supporting cash flow and future growth. Property and land-market changes also affect several taxes and fund revenue simultaneously. Finally, one-off receipts and base effects can distort year-on-year comparisons.
Fiscal revenue is best understood as a joint report on the nominal economy, profits, asset markets and policy choices—not as a simple proxy for real GDP.
13. A six-step method for reading China’s monthly fiscal release
First, check the headline general public budget revenue and its growth rate.
Second, separate tax and non-tax revenue. Strong tax growth usually carries more information about recurring economic bases; large non-tax movements require investigation of one-off factors.
Third, compare VAT with corporate income tax. The first is closer to transactions and the nominal economy, while the second reflects taxable profit.
Fourth, use individual income tax, consumption tax and trade taxes to examine household income, selected consumption and external activity, without over-interpreting a single series.
Fifth, read deed tax, land appreciation tax and land-sale proceeds together. The first two belong to the general public budget and the third to the government-managed funds budget.
Sixth, connect central and local figures, revenue and spending, and current revenue and debt financing. Only then can the strength and sustainability of fiscal policy be judged.
Conclusion: revenue is about how the state mobilises resources
Treating fiscal revenue as “what the government earns” mixes taxes, land sales, state-enterprise returns, social insurance contributions and borrowing into one misleading number. These resources enter different accounts, serve different purposes and carry different obligations.
The 2025 results and the first five months of 2026 point to a structural transition. General public budget and tax revenue have improved, with strength in VAT, individual income tax and capital-market-related taxes. Corporate income tax has recovered more slowly, while property-related taxes and land-sale proceeds remain under pressure.
The central question is not simply how to collect more. It is how to build stable tax bases, reduce reliance on land and one-off receipts, align local resources with expenditure responsibilities, improve returns on public assets, use budget funds more effectively and balance growth support, social protection and debt sustainability.
To understand government revenue is to understand how the state mobilises economic resources and converts them into public services, macroeconomic policy and long-term development.
A practical test of revenue quality: Is the money generated by recurring production, consumption, profits and income, or does it depend heavily on asset sales, resource transfers, one-off remittances and ever-rising leverage?
A practical test of revenue quality: Is the money generated by recurring production, consumption, profits and income, or does it depend heavily on asset sales, resource transfers, one-off remittances and ever-rising leverage?
Sources and notes
- Ministry of Finance, 2025 Fiscal Revenue and Expenditure, Jan. 30, 2026.
- Ministry of Finance, Fiscal Revenue and Expenditure, Jan–May 2026, June 22, 2026.
- Ministry of Finance, Report on 2025 Budget Execution and Draft 2026 Budgets.
- National Bureau of Statistics, 2025 Statistical Communiqué.
- National Bureau of Statistics, First-Half 2026 Economic Release, July 15, 2026.
Accounting note: the four budget accounts transfer funds among themselves, so their totals cannot simply be added. Government bonds are financing sources rather than ordinary current revenue. Ratios in this article are calculated from official data and may differ slightly because of rounding.

Taxes in a Chinese Life
From birth to retirement, follow the life of Xiao Lin and discover the taxes — both visible and invisible — that shape a Chinese person's financial journey. VAT, deed tax, vehicle purchase tax, PIT, and more.

U.S. Personal Income Tax: Why It Is Far More Than a Rate Table
2026 brackets, standard deductions, the new 2025 tax law, state variation, capital gains treatment, and the enforcement architecture behind the U.S. individual income tax.

AI Regulation Is Becoming an Operations Problem
The EU AI Act shows how AI governance is moving from principles to documentation, controls, transparency, and day-to-day operations.